After having played around with Elasticsearch for indexing PI payloads and indexing ABAP source code, and especially after seeing Kibana 4, it occurred to me that Elasticsearch would actually be great for business intelligence reporting.
As a proof of concept, I wrote a little extraction program (see below for a link to the source) to read sales data from a development system and export it to Elasticseach. It is very rudimentary and you should of course read the warnings (because it is only a proof of concept after all).
What this demonstrates, however, is how quick and easy it is to do this kind of reporting in Elasticsearch, and in fact to extract the data from SAP. (Elasticsearch really requires zero configuration to get going, as opposed to Apache Solr, which I have used in the past). There are of course many areas for improvement in this solution, one of the important ones being the need to configure the index upfront to set certain fields not to be analyzed. This would be particularly true for the customer name, if you wanted to use that for reporting, or add material description instead of using the code.
Note that it is very tempting to want to normalize the data. There might be valid reasons for that: for example, you may want to change the name of a customer or description of a material on SAP at some stage. However, just for the sake of saving a few MiB of disk space it is really not worth the effort, and you wouldn’t gain any performance advantage from it anyway.
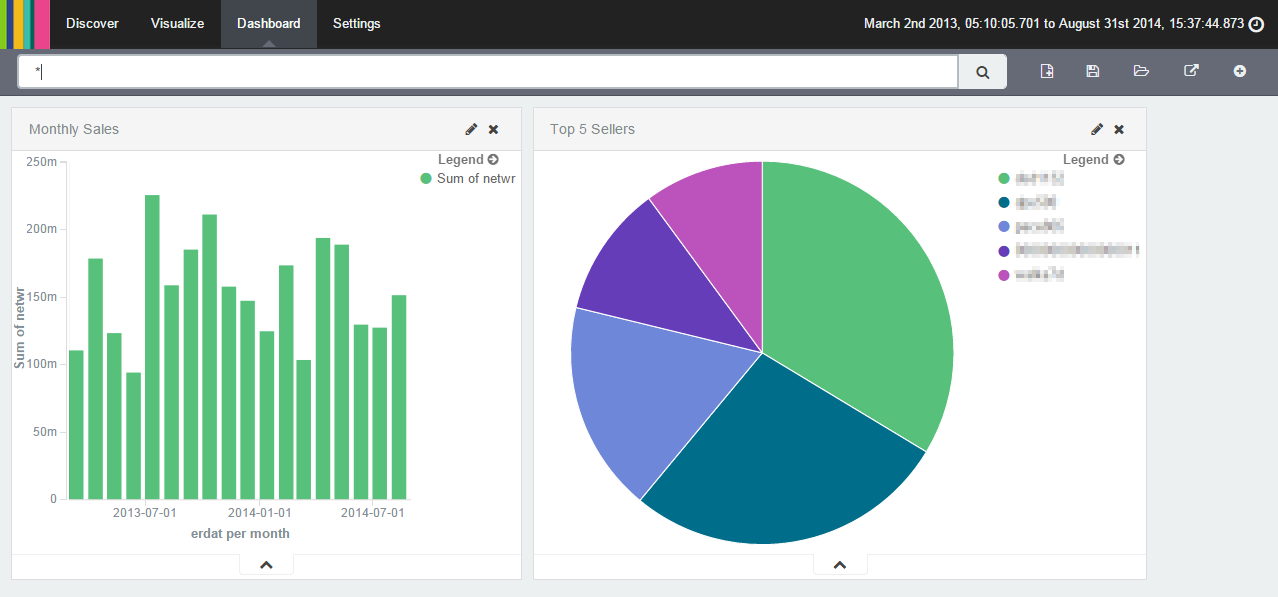
Nonetheless, just to test it out, I set up two little queries with Kibana 4 and made them into a little dashboard showing the value of sales per month and the value of sales by the top 5 materials.
Kibana gives you some very nifty”slice-and-dice” and “drill-down” features. For example, you can select a value (like a slice of the pie chart) or drag-select a certain period of time on the above dashboard, and it will automatically filter the data by that selection.
On the other hand, Kibana gives you rather limited functionality in terms of visualizing the data (e.g. setting labels on pie chart slices does not seem possible) which your users are probably going to demand, but for that you have many options such as building a dashboard with the likes of the D3 javascript library or so. (In fact, there is an Elasticsearch blog post on just this topic). The possibilities are virtually limitless and, with a little elbow grease, you can come up with some great reports.
The source for the extract program, if you are interested, is here: https://gist.github.com/mydoghasworms/1beaf4b8d013fe7ee95a. To test it out, you will need an ECC system with some sales data, and a running Elasticsearch server, which you can easily set up by extracting the downloaded file and installing the service. You will also need to install Kibana 4, which (as opposed to the old Kibana, which ran as a plugin on the Elasticsearch server). If you need help setting it up, please drop me a comment below!
(This article has been adapted from the original here).
